
A practical guide to building white-label SEO reports that clients actually read, then automating delivery so your agency saves dozens of hours every month.
How to Create White-Label SEO Reports and Automate Them
White-label SEO reporting is the difference between an agency that looks like a vendor and an agency that looks like a partner. Every month, thousands of agencies and freelancers export raw data from Google Search Console, paste it into a slide deck, and hope the client understands it. The client rarely does. What they understand is a branded document that opens with a plain-language answer to one question: did my investment work this month?
This guide walks through how to build that document under your own brand, then automate the entire pipeline so it ships on schedule without anyone touching it.
Quick Answer: To create white-label SEO reports, connect your data sources, choose five to seven client-relevant KPIs, build a branded template with your logo and colors, and add a written insight summary. Then automate it by scheduling recurring exports and email delivery through your reporting platform, removing manual work entirely.
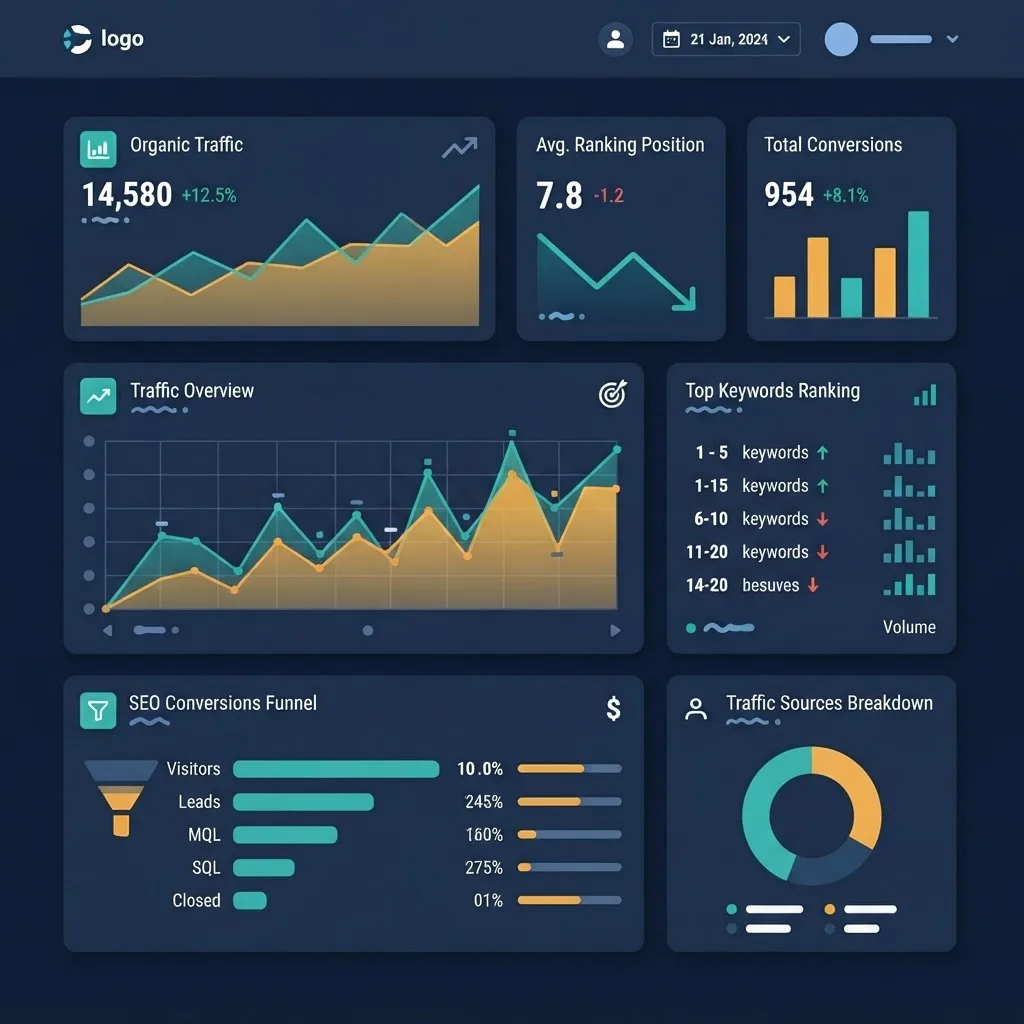
What Is a White-Label SEO Report?
A white-label SEO report is a performance document that presents SEO data under your agency's brand instead of the tool vendor's brand. The data may come from Google Search Console, Google Analytics 4, Ahrefs, Semrush, or a rank tracker, but the logo, colors, footer, and often the domain belong to you.
There are two distinct things people mean by the phrase, and mixing them up causes pricing confusion:
- White-label reporting means you produce the work and only rebrand the reporting layer.
- White-label SEO delivery means a partner performs the SEO work and you resell it under your name. If that model is what you are evaluating, the mechanics are covered in detail in this breakdown of what is white-label SEO.
This article focuses on the reporting layer, which applies to both models.
Why Automated Reporting Is Now a Competitive Requirement
Manual reporting quietly eats agency margin. Industry surveys of agency operations consistently place reporting among the top three most time-consuming non-billable tasks, with agencies commonly reporting three to six hours per client per month spent on data collection and formatting. At twenty clients, that is a full-time role spent copying numbers.
Two factual anchors are worth keeping in mind while you design your system:
- Google Search Console retains only 16 months of performance data. If you are not archiving exports, your year-over-year comparisons will eventually break.
- The GSC API returns data with a two to three day lag, which means a report scheduled for the first of the month will show incomplete final days unless you offset the schedule.
Both constraints shape how you automate, not just whether you automate.
Step 1: Define the Reporting Question Before Touching Data
Start with the single question the client cares about, then work backwards. An e-commerce client asks whether organic revenue grew. A local service business asks whether the phone rang more. A SaaS company asks whether qualified signups from search increased.
Write that question at the top of the template as a literal heading. Every chart below it must help answer it. This one habit eliminates roughly half the charts most agencies include out of reflex.
Choose Five to Seven KPIs, Not Thirty
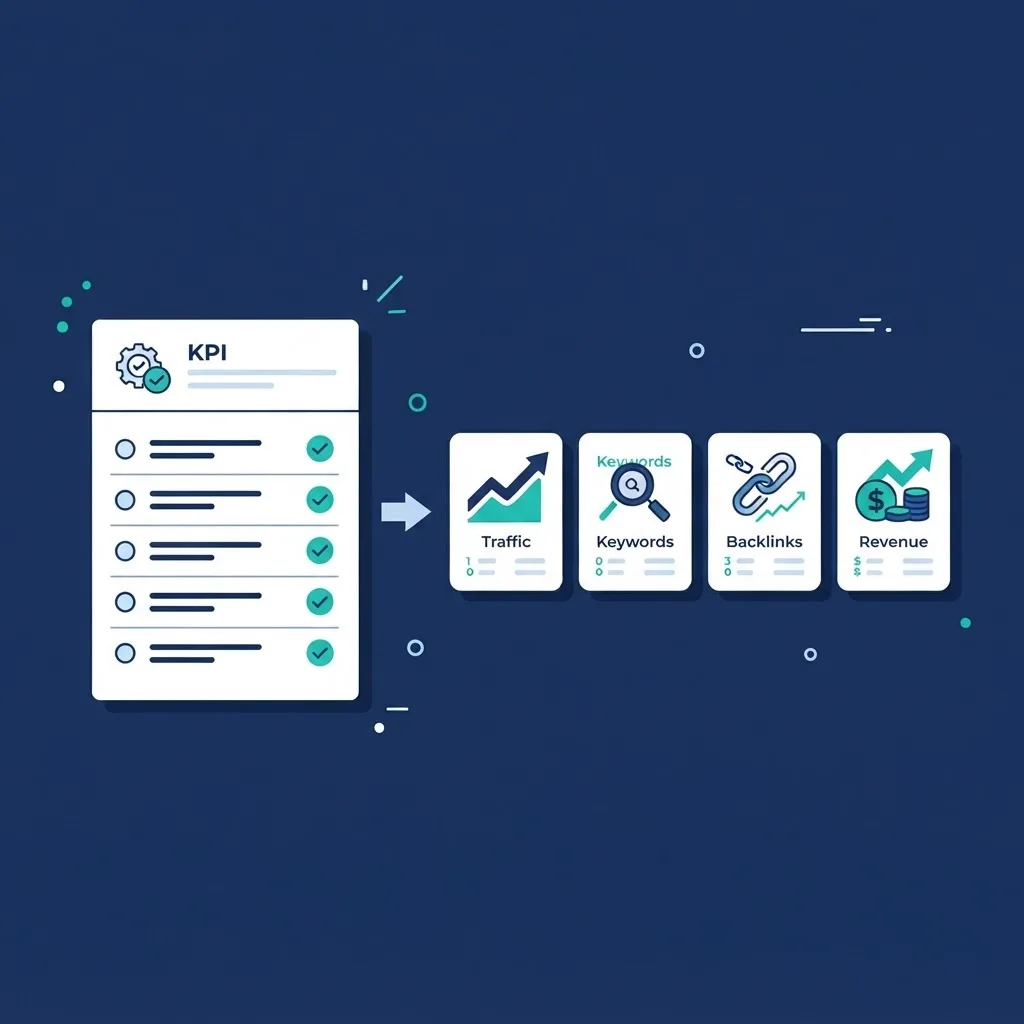
More metrics reduce comprehension. A defensible core set looks like this:
- Organic sessions and organic conversions or revenue
- Non-branded clicks and impressions from Search Console
- Keyword visibility for a fixed tracked set
- Referring domains gained and lost
- Indexed pages versus published pages
- Core Web Vitals pass rate
- Work completed and work planned
Separate branded from non-branded queries. Branded search often rises because of paid campaigns or PR, and counting it as SEO success is the most common way agencies accidentally overstate results.
Step 2: Connect and Normalize Your Data Sources
Automation fails at the connection layer more often than at the design layer. Before building anything visual, standardize four things across every client account:
- Naming conventions. Use an identical property naming pattern so lookups do not break.
- Timezone and currency. Mismatched analytics timezones create phantom day-over-day swings.
- Conversion definitions. Agree in writing on which GA4 events count as conversions.
- Access ownership. Client-owned properties with agency access granted, never the reverse. This protects the client and removes offboarding disputes.
Agencies that treat data hygiene as a setup task rather than a monthly firefight are the ones whose automation actually holds up. Teams like ZoneTechify build this normalization step into onboarding so the reporting pipeline is stable from month one rather than patched later.
Step 3: Build the Branded Template
Your template is a reusable asset. Build it once, clone it per client.
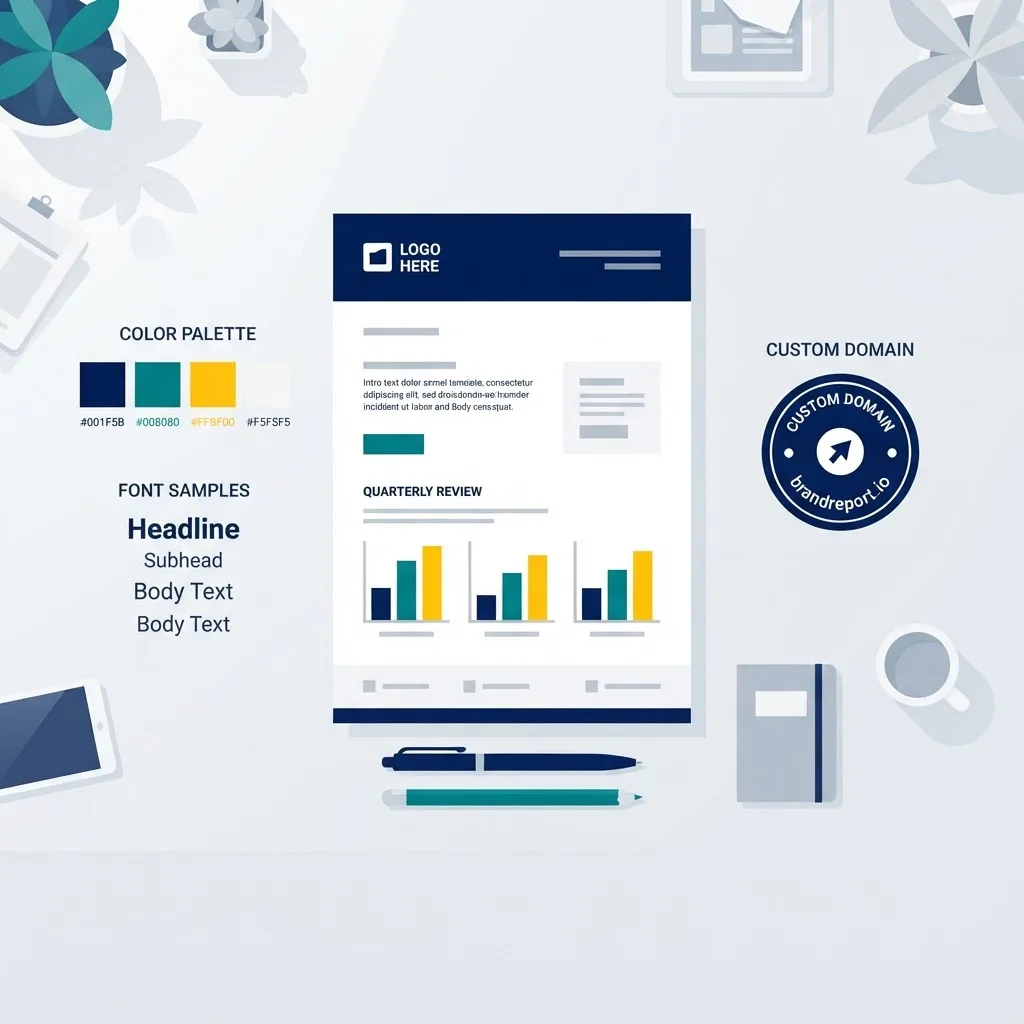
Branding Elements to Configure
- Logo in the header, on every page, not only the cover
- Two brand colors maximum in charts so trends stay readable
- One typeface for headings and one for body copy
- A custom reporting subdomain such as reports.youragency.com when the platform supports it
- Your contact block and next-meeting date in the footer
A custom domain matters more than most agencies think. When a client forwards a report to their CFO, a vendor-branded URL invites the question of who is actually doing the work.
The Five-Section Structure That Works
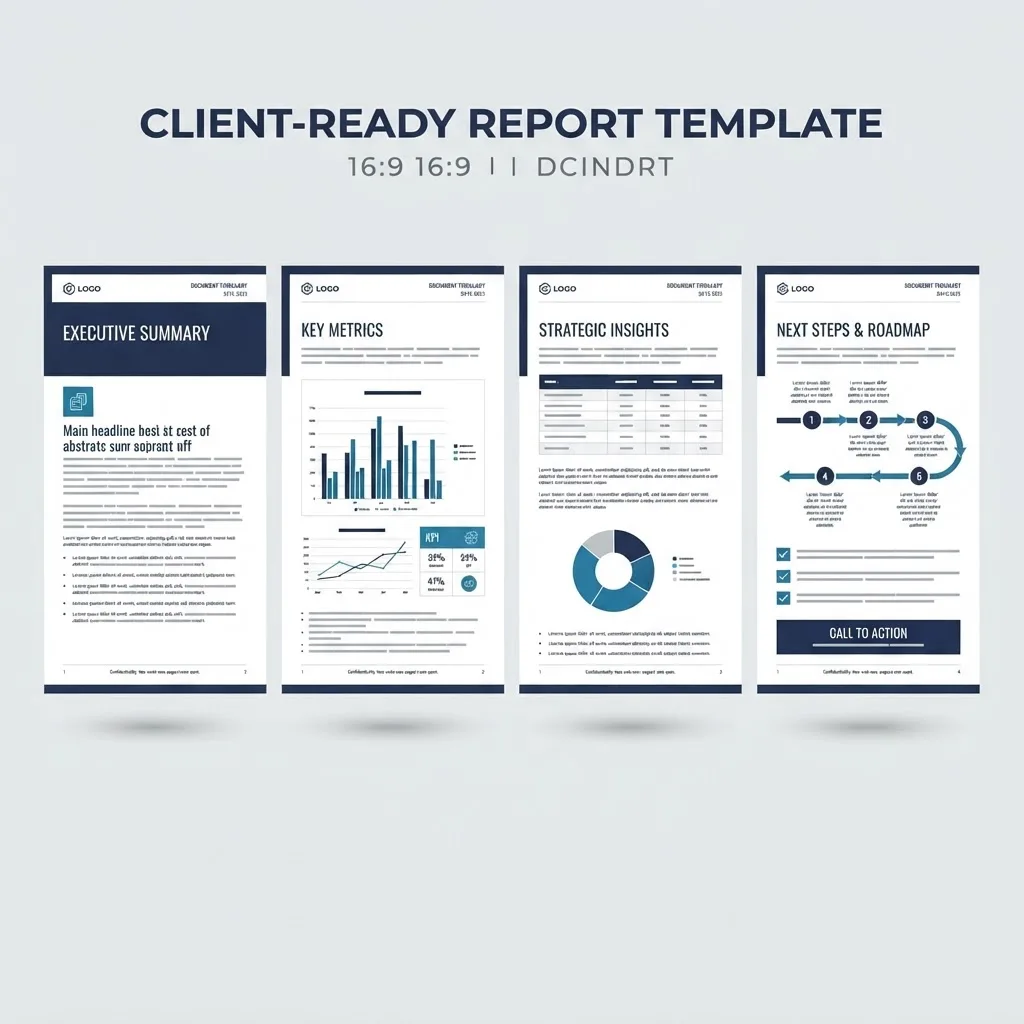
- Executive summary. Three to five sentences in plain language. No jargon.
- Performance against goals. The target, the actual, the variance.
- What we did. Specific deliverables shipped this period.
- What we learned. One genuine insight, including negative findings.
- What is next. Dated commitments for the coming period.
Section four is the trust builder. Reporting a page that lost rankings, with your diagnosis and fix, signals expertise far more credibly than a page of green arrows.
Step 4: Automate Collection, Assembly, and Delivery
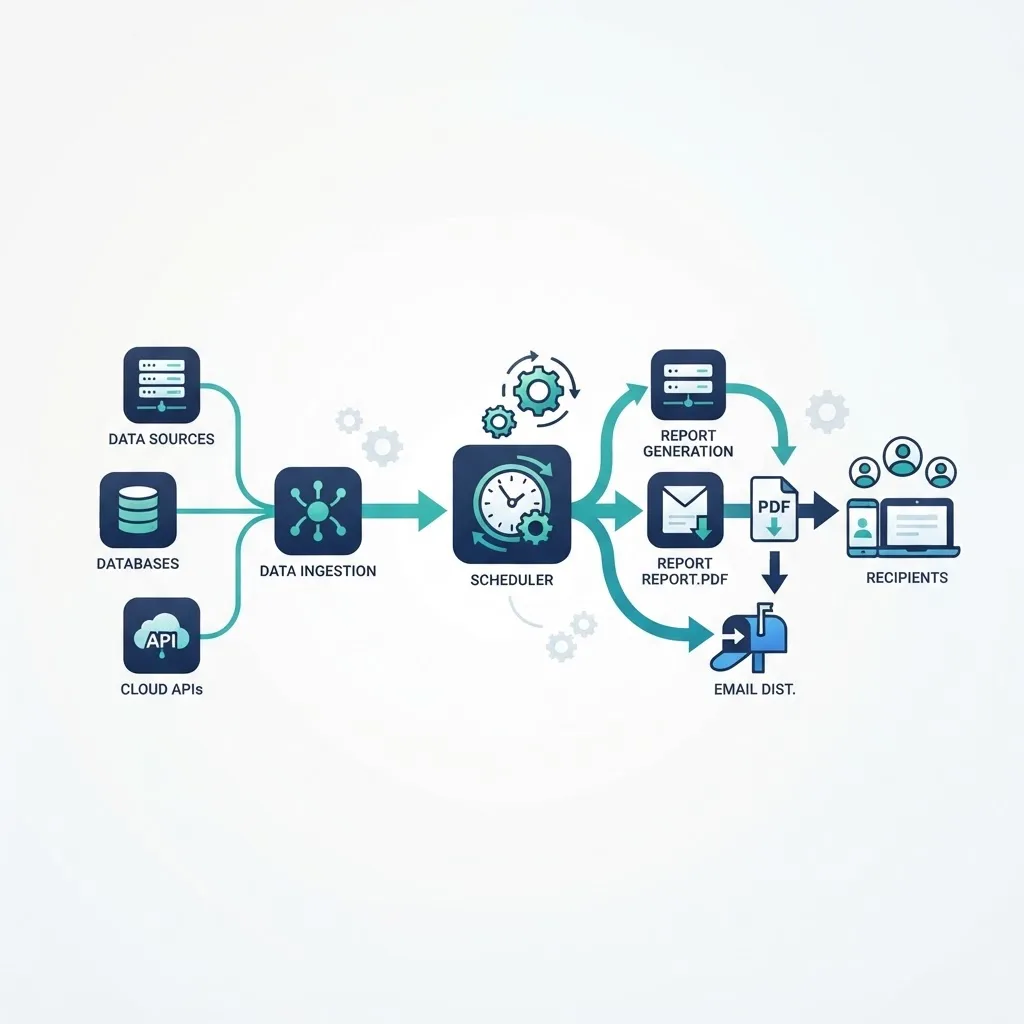
Automation has three separate stages, and you can automate them independently.
| Stage | What It Does | Automation Method | Manual Time Saved |
|---|---|---|---|
| Collection | Pulls data from GSC, GA4, rank trackers, backlink tools | Native API connectors or scheduled script exports | High |
| Assembly | Populates the branded template with current-period data | Template cloning with dynamic date ranges | High |
| Narrative | Writes the summary and insight sections | Partial, human review required | Low to medium |
| Delivery | Sends the PDF or live link on schedule | Scheduled email or shared dashboard link | Medium |
| Archiving | Stores historical snapshots beyond tool retention | Automated export to cloud storage | Medium |
Schedule delivery for the fifth to seventh day of the month rather than the first. This clears the Search Console data lag and gives you a review window before the client sees anything.
Practical Automation Stack Options
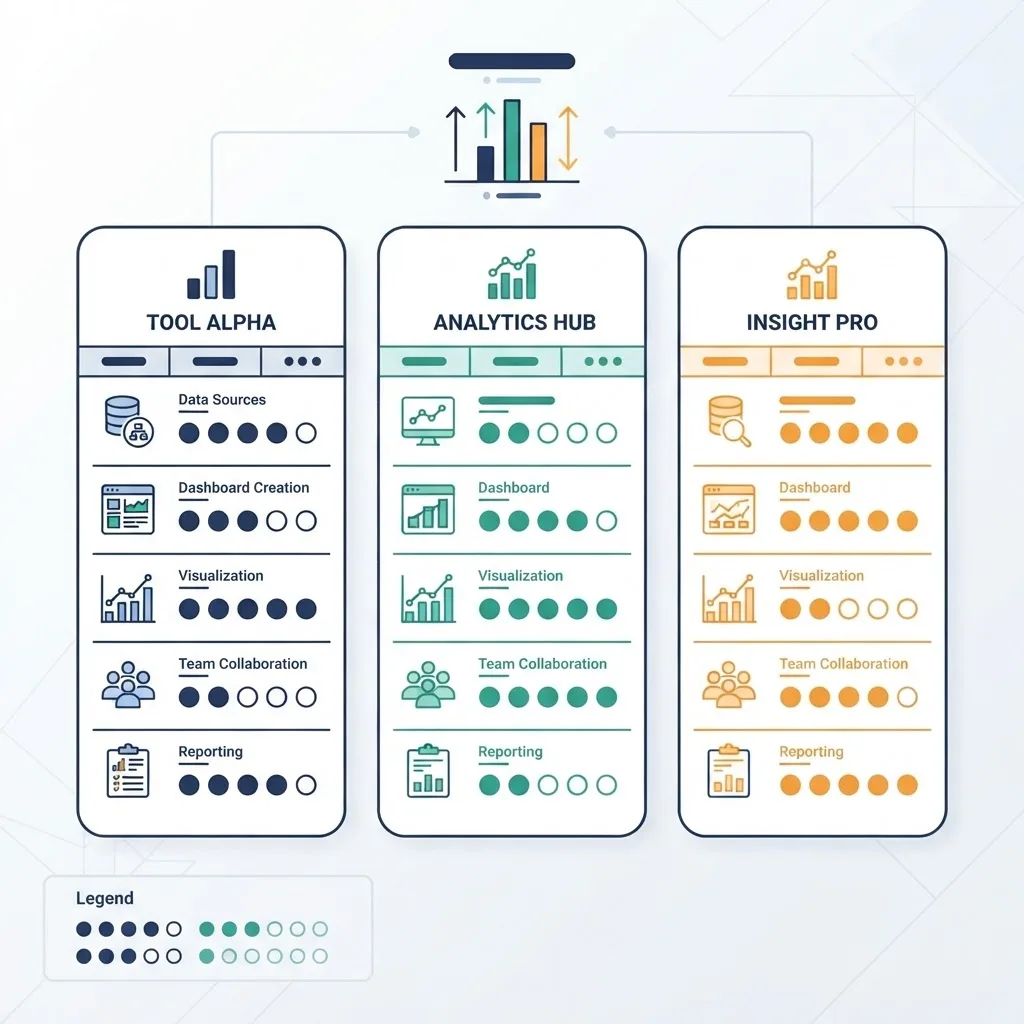
- Platform-native scheduling. Reporting tools with built-in white-label settings and recurring email delivery. Fastest to launch, least flexible.
- Spreadsheet plus API connectors. A Google Sheets backend pulling from APIs, feeding a Looker Studio template. Cheap, highly customizable, requires maintenance.
- Custom internal dashboard. A build that pulls APIs into your own database and renders client-facing reports. Highest control, highest upfront cost, best long-term margin at scale.
Agencies crossing roughly twenty-five to thirty retained clients usually find the custom route pays back within a year. If you go that direction, the build quality of the data layer determines whether it becomes an asset or a liability, which is why engineering-led teams offering scalable web solutions are a common partner choice for the dashboard layer.
Step 5: Keep a Human in the Loop
Fully automated reports fail in a specific way: they deliver confidently wrong narratives. A tracking tag breaks, conversions drop to zero, and the automation cheerfully emails a client a report showing total collapse.
Build two safeguards:
- Anomaly thresholds. Flag any metric moving more than forty percent period over period for manual review before send.
- A five-minute review gate. One person confirms the numbers are plausible and writes the summary. Everything else stays automatic.
This hybrid model is what separates automation from abdication. The data assembly is machine work. The interpretation is expert work, and interpretation is what clients are paying for.
Step 6: Scale the System Across Your Client Base
Once one client works end to end, scaling is a templating exercise, not a redesign.
- Maintain one master template per client type, not per client
- Store client-specific variables such as goals and tracked keywords in a single source of truth
- Version your template and log changes so month-to-month comparisons stay valid
- Audit two random reports each month for accuracy
- Review the KPI set quarterly with each client and remove metrics nobody discusses
The last point is the most neglected. Reports accumulate charts the way garages accumulate boxes. If a metric has not been mentioned in three consecutive client calls, delete it.

Common Mistakes That Undermine White-Label Reports
- Sending raw tool exports with a logo pasted on top
- Reporting rankings without traffic or revenue context
- Mixing branded and non-branded search into one number
- Omitting the work log, which makes retainers feel unjustified
- Using different date ranges across charts in the same document
- Hiding losses, which destroys credibility the moment the client notices independently
Key Takeaways
- A white-label SEO report presents third-party data under your agency brand across logo, colors, footer, and ideally a custom domain.
- Google Search Console retains 16 months of data and lags two to three days, so archive exports and schedule delivery for day five to seven of the month.
- Five to seven KPIs outperform large metric dumps because comprehension, not volume, drives client retention.
- Collection, assembly, delivery, and archiving can be fully automated; the narrative summary should stay human-reviewed.
- Anomaly thresholds at forty percent period-over-period change prevent automated reports from sending broken data.
- Custom in-house reporting infrastructure typically becomes cost-effective past roughly twenty-five to thirty retained clients.
Frequently Asked Questions (FAQ)
What should be included in a white-label SEO report?
Include an executive summary in plain language, performance against agreed goals, a log of completed work, one genuine insight including any losses, and dated next steps. Add five to seven KPIs such as organic conversions, non-branded clicks, keyword visibility, and referring domains. Keep branding consistent on every page.
How often should I send automated SEO reports to clients?
Monthly reporting suits most retainers because SEO changes are rarely meaningful week to week. Send between the fifth and seventh day of the month so Search Console data is complete. Provide a live dashboard link for clients who want continuous access, and reserve quarterly reports for strategic reviews.
Can I fully automate SEO reporting without any manual work?
You can fully automate data collection, template assembly, delivery, and archiving. Do not automate the written analysis. A short human review catches broken tracking, seasonal distortions, and misleading spikes. Budget five minutes per report for that review gate and everything else runs unattended.
How do I white-label reports so clients cannot see the tool provider?
Upload your logo, set two brand colors, choose your typefaces, remove vendor footers, and map a custom subdomain such as reports.youragency.com. Send from your own email domain with authenticated records. Check the PDF metadata and file name, since those frequently leak the original tool name.
Is white-label SEO reporting worth it for a small agency?
Yes, especially for small agencies. If reporting consumes four hours per client monthly, automating ten clients recovers about forty hours a month for billable work. Branded reports also justify higher retainers because they position you as the accountable strategist rather than a reseller of tool exports.
What is the difference between a white-label report and a client dashboard?
A white-label report is a periodic snapshot with written interpretation and a work log. A dashboard is always-on live data with no narrative. Most agencies use both: the dashboard satisfies clients who want constant visibility, while the report provides the analysis and accountability that drive renewals.