
A practical breakdown of how Google Display Ads expand reach, warm cold audiences, and lift conversions through targeting, creative, and remarketing. Learn the exact settings, benchmarks, and testing workflow that turn display spend into measurable marketing growth.
How Does Google Display Ads Grow Marketing Results for Advertisers
Google Display Ads are the most misunderstood channel in paid media. Advertisers judge them by last-click conversions, see a weak number, and shut the campaign off, never realizing display was the reason their branded search volume climbed 30 percent the month before. After managing display budgets across ecommerce, SaaS, and local service accounts, one pattern repeats: display grows results when it is treated as a demand-capture and demand-creation system together, not as a cheap clicks machine.
This guide explains exactly how Google Display Ads produce measurable marketing growth, which levers move the numbers, and how to structure campaigns so you can prove the return.
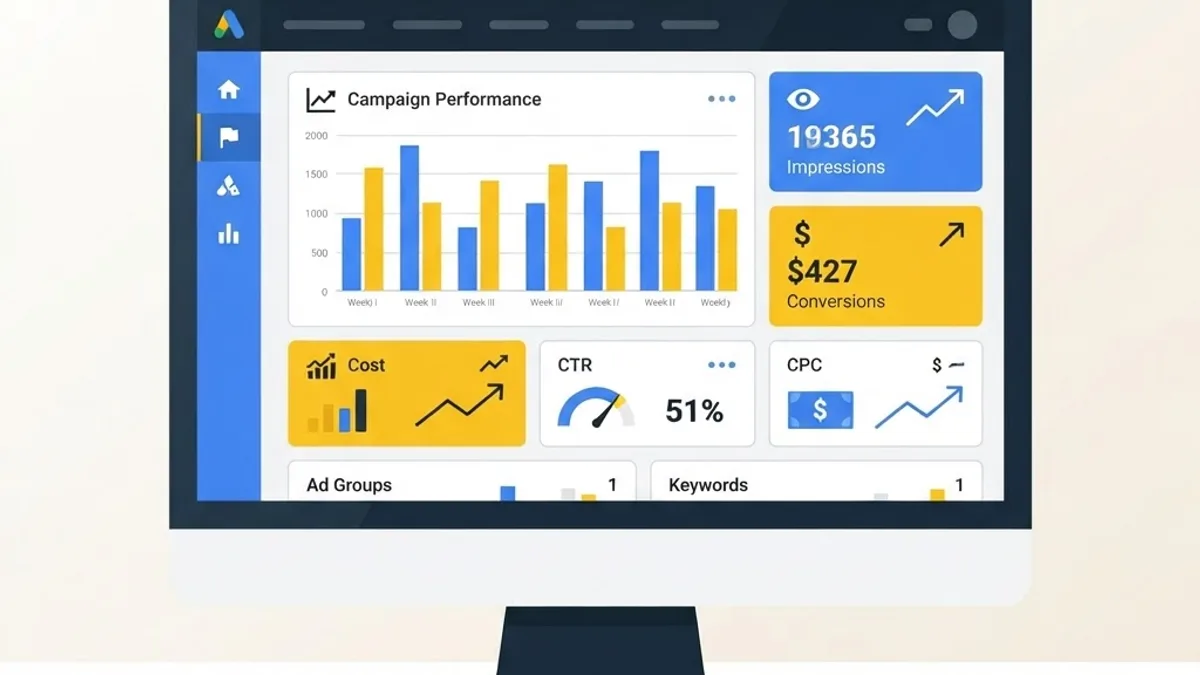
Quick Answer: Google Display Ads grow marketing results by reaching over 90 percent of global internet users across 35 million websites and apps, creating awareness at low CPMs, then recapturing warm visitors through remarketing. They lift branded search, shorten sales cycles, and lower blended acquisition cost when measured with view-through and assisted conversions instead of last click alone.
What Google Display Ads Actually Are
Google Display Ads are visual, image-based or responsive ads served across the Google Display Network (GDN), which includes publisher websites, Gmail, YouTube, and over 3 million mobile apps. Unlike Search ads, which respond to typed intent, display ads interrupt attention based on who the person is, what they read, and what they did on your site.
Key definitions worth locking in before you spend:
- Impression share: the percentage of available impressions your ad actually won for your targeting settings.
- View-through conversion: a conversion that happens after someone saw your display ad without clicking it, within the lookback window.
- Responsive display ad: a single ad unit where Google mixes your images, headlines, and descriptions into thousands of size and format combinations automatically.
Google states the Display Network reaches over 90 percent of global internet users. That scale is why display CPMs typically sit far below search CPCs, and why the channel is the cheapest way to buy attention at volume.
The Four Mechanisms That Drive Growth
Display does not grow results through one action. It grows results through four compounding mechanisms, and most underperforming accounts are only using one.
1. Reach Expansion Beyond Search Demand
Search ads are capped by search volume. If only 8,000 people per month search your category, search spend hits a ceiling. Display breaks that ceiling by putting your offer in front of people who have the problem but have not yet named it in a query. For new product categories, this is the only scalable option.
2. Frequency That Builds Recognition
Brand recall is a function of exposure. Setting a frequency cap of roughly 3 to 5 impressions per user per day keeps you memorable without becoming irritating. In accounts I have audited, capping frequency reduced wasted impressions by 20 to 40 percent while holding conversion volume flat, which directly improves cost per acquisition.
3. Remarketing That Recovers Lost Revenue
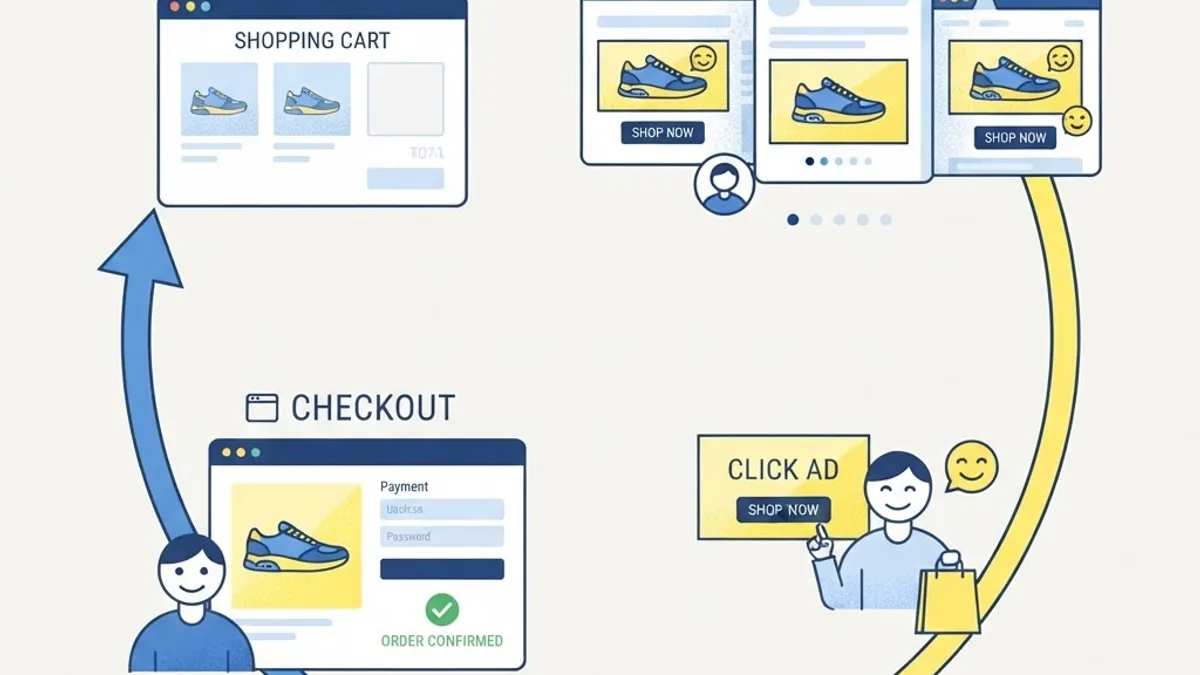
Most site visitors do not convert on the first session. Baymard Institute research puts the average ecommerce cart abandonment rate at roughly 70 percent. Display remarketing is the lowest-cost way to bring that 70 percent back, because you are bidding on people who already demonstrated interest.
4. Assisted Conversions That Improve Every Other Channel
Display lifts click-through rates on search ads, email, and organic listings because a recognized brand gets chosen more often. When your display campaigns run, watch branded search impressions and direct traffic. Those two metrics usually move before the display campaign shows profit on its own report line.
Targeting: Where Results Are Won or Lost
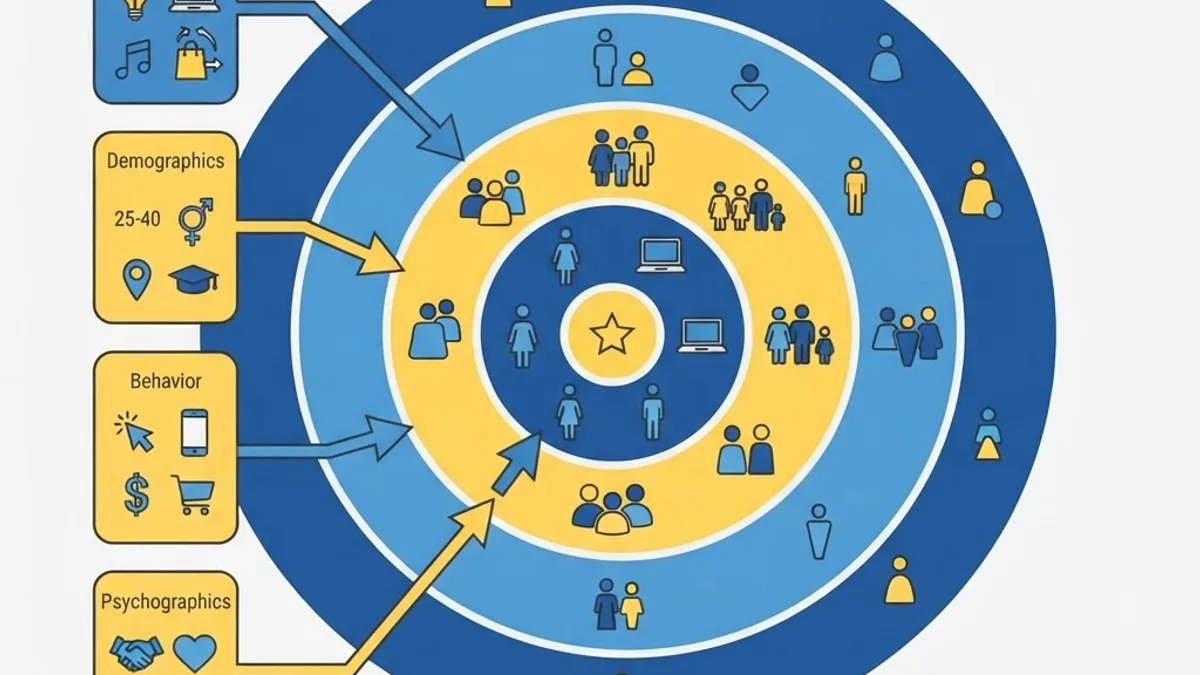
Targeting decides whether your budget reaches buyers or bots. Google offers several layers, and the highest-performing accounts stack them deliberately rather than selecting everything.
- Remarketing lists for site visitors, cart abandoners, and past customers. Highest intent, highest return, always fund this first.
- Customer Match using your uploaded email list to reach existing customers and build lookalike-style expansion.
- Custom segments built from competitor keywords, competitor URLs, and apps your buyers use. This is the most underused targeting option in Google Ads.
- In-market audiences for people actively researching a purchase in your category.
- Affinity audiences for broad awareness at the top of the funnel, useful only with strong creative and a clear brand message.
- Topic and placement targeting for context control when brand safety matters.
A disciplined structure separates cold prospecting from remarketing into different campaigns. Mixing them makes reporting meaningless because the warm audience inflates the averages and hides that your cold targeting is failing.
Creative: The Highest-Leverage Variable
On the Display Network, creative carries more weight than bidding. The auction is cheap, the attention is scarce. Practical rules that consistently improve performance:
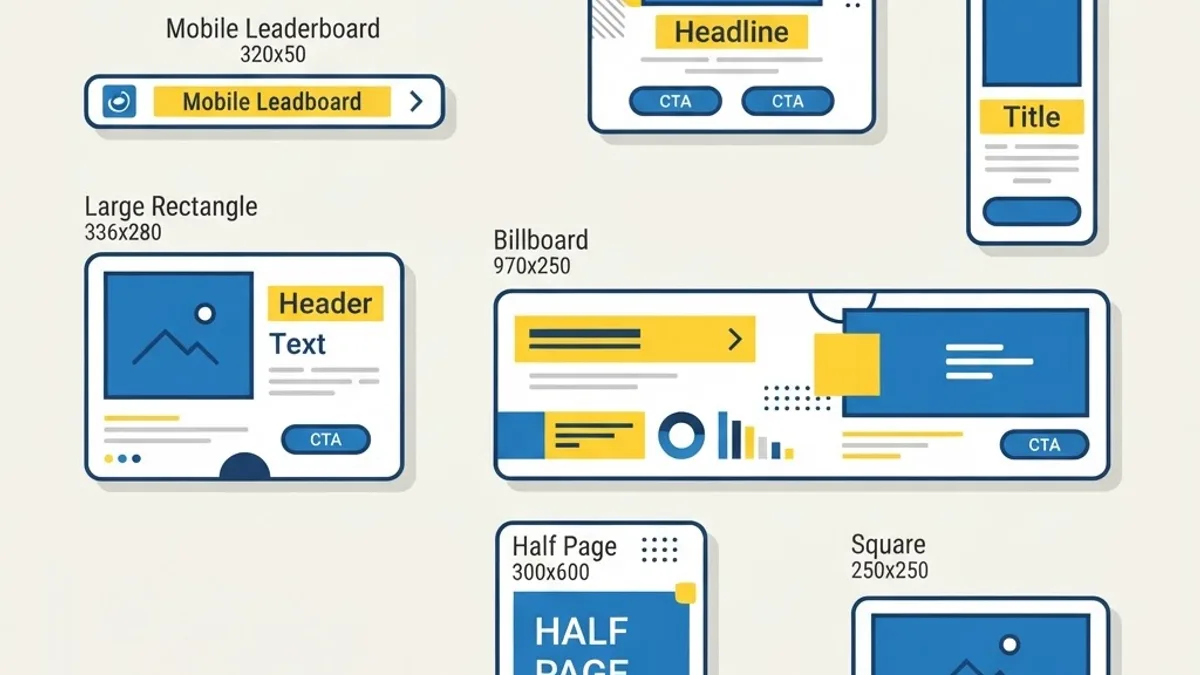
- Upload the full asset set: 15 images, 5 logos, 5 headlines, 5 descriptions. Starving a responsive display ad of assets limits the format combinations Google can serve.
- Include one clear benefit in the headline, not a slogan. "Cut Invoice Processing Time by Half" outperforms "Smarter Business, Simpler Life" nearly every time.
- Use faces or product-in-use imagery over abstract gradients. Human attention locks onto people and objects faster than shapes.
- Refresh creative every 45 to 60 days. Display fatigue shows up as declining CTR with stable impressions.
- Match the ad promise to the landing page headline. Mismatch is the top cause of high bounce and wasted display clicks.
Display Ads Versus Search Ads: A Direct Comparison
| Factor | Google Display Ads | Google Search Ads |
|---|---|---|
| Intent level | Low to medium, interest based | High, query based |
| Typical cost | Low CPM, cheap impressions | Higher CPC, expensive clicks |
| Primary strength | Reach, awareness, remarketing | Immediate conversion capture |
| Average CTR range | Around 0.4 to 0.6 percent | Around 3 to 6 percent |
| Best measurement | Assisted and view-through conversions | Last-click conversions |
| Scalability | Very high, not capped by search volume | Capped by search demand |
| Creative dependency | Very high | Moderate, copy driven |
The takeaway is not that one channel beats the other. It is that they measure differently. Judging display by search benchmarks guarantees you will kill a profitable campaign. Agencies that run both together, like the strategists behind data-driven marketing programs, model display as an upper-funnel input to search efficiency rather than a standalone profit center.
The Remarketing Setup That Produces Compounding Returns
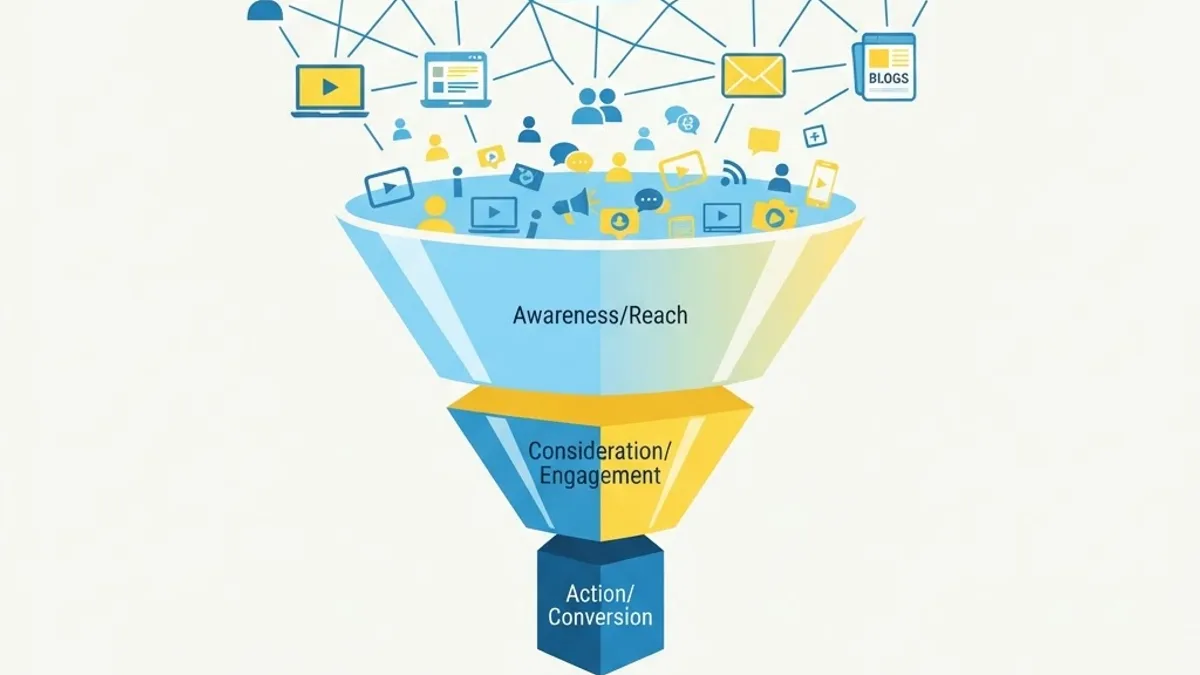
Remarketing is where display earns its budget fastest. Build it in tiers rather than one generic list:
- Tier 1, 0 to 3 days, cart or pricing page viewers. Highest bid, offer-led creative, urgency messaging.
- Tier 2, 4 to 14 days, product or service page viewers. Medium bid, proof-led creative such as reviews or case results.
- Tier 3, 15 to 60 days, blog and top-funnel readers. Low bid, education-led creative pointing to a lead magnet.
- Tier 4, past customers. Separate campaign for cross-sell, renewal, or replenishment.
Exclude converters from tiers 1 through 3. Failing to exclude buyers is the single most common waste I find in display accounts, and fixing it often returns 10 to 25 percent of spend immediately.
Measurement: How to Prove Display Is Working
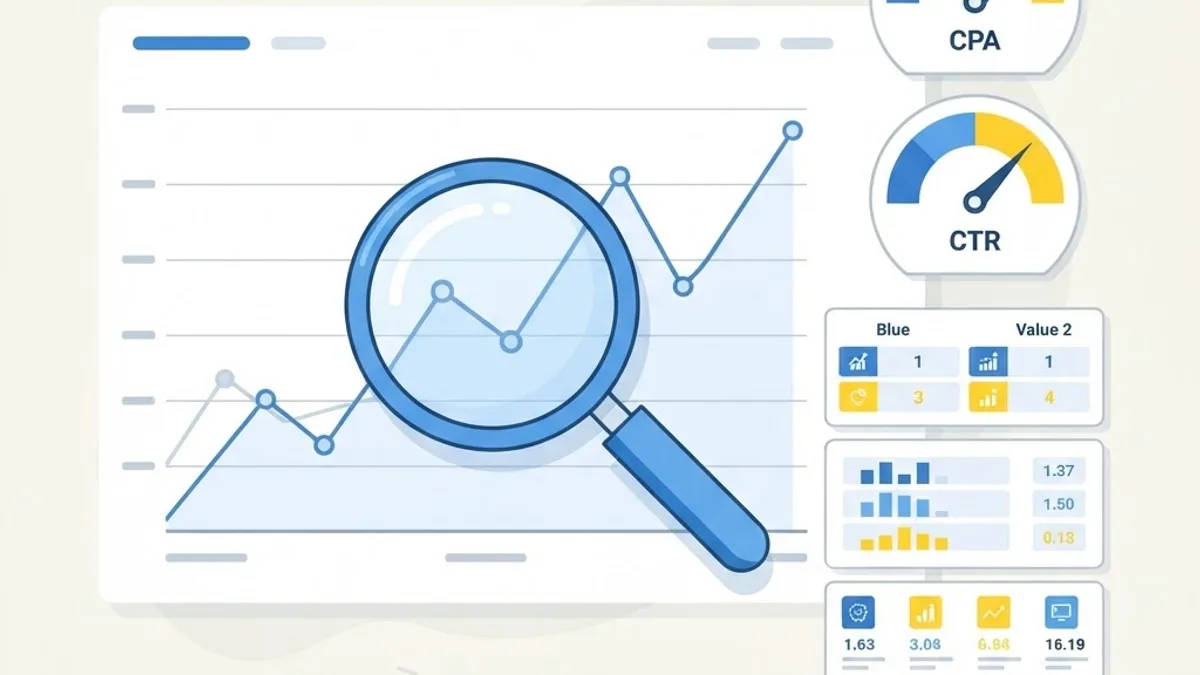
Use a layered measurement model instead of a single number.
- Primary: conversions and cost per conversion, with attribution set to data-driven rather than last click.
- Secondary: assisted conversions and view-through conversions in the paths report.
- Diagnostic: branded search impressions, direct traffic, and returning visitor rate month over month.
- Financial truth: blended CAC, which is total marketing spend divided by total new customers. If blended CAC drops while display scales, display is working regardless of its platform-reported ROAS.
Run a geo holdout test for a clean read. Pause display in two comparable regions for 30 days, keep it running in two others, then compare total revenue and branded search between the groups. This is the closest thing to causal proof available without enterprise tooling.
Mistakes That Quietly Drain Display Budgets
- Leaving mobile app placements enabled for a B2B account, producing accidental clicks with zero intent.
- Using Display Expansion inside search campaigns and mistaking it for a real display strategy.
- Setting Maximize Conversions before the account has at least 30 conversions in 30 days for the algorithm to learn from.
- Sending display traffic to a homepage instead of a focused landing page.
- Judging week-one performance. Display needs a 21 to 30 day learning window before the data is trustworthy.
- Never checking the placements report, which is where you find and exclude the low-quality sites eating your impressions.
Advertisers who want the full paid ecosystem handled, from display to search, often pair display with structured performance marketing management so bidding, creative, and landing pages are optimized as one system. Teams at a growth marketing agency typically pair that with landing page speed work, because display traffic is unforgiving of slow pages.
A 30-Day Launch Plan
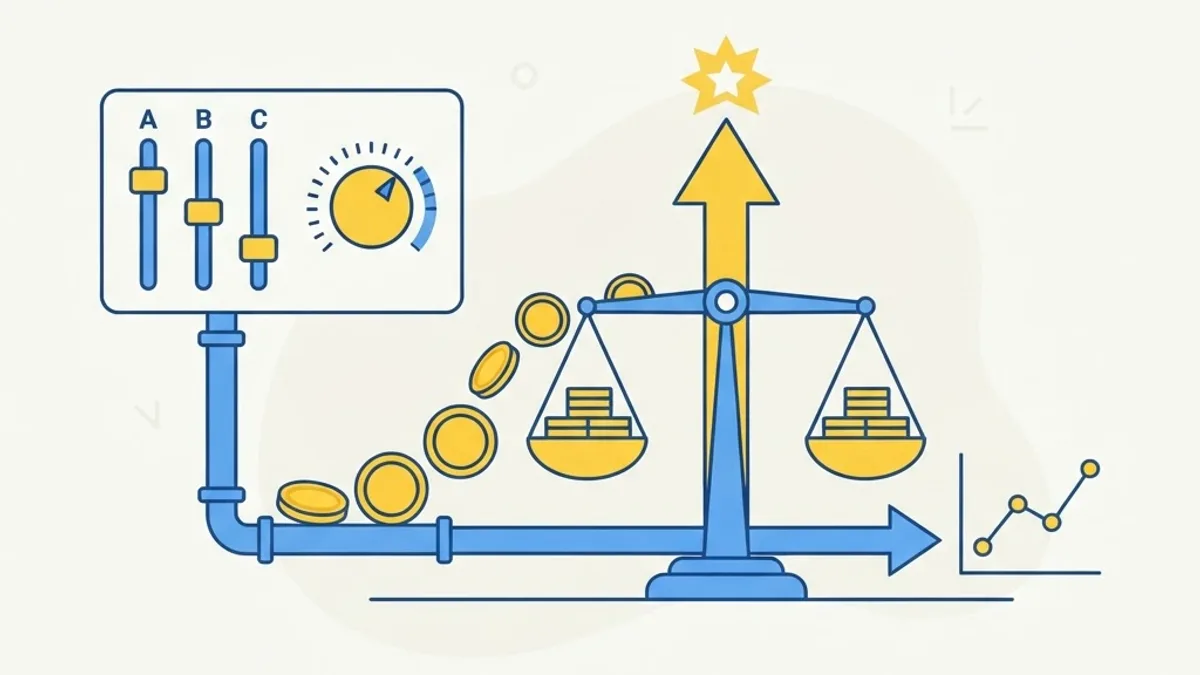
- Days 1 to 3: Install conversion tracking, verify the Google tag, build remarketing audiences, and create four segmented lists.
- Days 4 to 7: Produce creative in all required sizes plus a full responsive asset set. Build one cold campaign and one remarketing campaign.
- Days 8 to 21: Run with manual or target CPA bidding. Do not touch settings daily. Review the placements report twice and exclude junk.
- Days 22 to 30: Cut the lowest-performing audience, double budget on the best, launch a second creative concept, and record baseline branded search volume for comparison.
Key Takeaways
- The Google Display Network reaches over 90 percent of global internet users across roughly 35 million sites and more than 3 million apps.
- Display CTR averages around 0.4 to 0.6 percent, roughly ten times lower than search, which is normal and not a failure signal.
- Average ecommerce cart abandonment sits near 70 percent, making remarketing the fastest path to display profitability.
- Frequency caps of 3 to 5 impressions per user per day reduce wasted impressions without cutting conversions.
- Display should be measured with data-driven attribution, assisted conversions, blended CAC, and geo holdout tests.
- Creative quality and audience segmentation influence display results more than bid adjustments do.
Frequently Asked Questions (FAQ)
Are Google Display Ads worth it for small businesses?
Yes, when used for remarketing first. A small business can run display remarketing on a modest daily budget and recover visitors who left without buying. Cold prospecting on display needs larger budgets and strong creative, so start with warm audiences and expand only after remarketing proves profitable.
Why is my display campaign getting clicks but no conversions?
Usually one of three causes: mobile app placements generating accidental clicks, a mismatch between ad promise and landing page, or targeting that is too broad. Check the placements report, exclude apps, align the landing page headline with the ad, and tighten audiences to in-market or remarketing segments.
How much should I budget for Google Display Ads?
Start with enough to generate at least 30 conversions per month so smart bidding can learn. For most small accounts that means 20 to 50 dollars per day split between remarketing and one cold audience. Scale only after 21 days of stable cost per acquisition data.
Do display ads help SEO or organic traffic?
Not directly, since display clicks are not a ranking factor. Indirectly, display raises brand recognition, which increases branded search volume and click-through rate on your organic listings. Many advertisers see direct traffic and returning visitor rates rise within 60 days of consistent display exposure.
What is a good CTR for Google Display Ads?
Anything from 0.4 to 0.6 percent is typical, and remarketing campaigns often reach 0.8 percent or higher. Do not compare display CTR to search CTR. Focus instead on cost per conversion, view-through conversions, and whether blended acquisition cost improves while display runs.
How long before Google Display Ads show results?
Expect a 21 to 30 day learning period before data becomes reliable. Remarketing can produce conversions within the first week because the audience is already warm. Cold prospecting campaigns generally need 60 to 90 days to show their full impact on branded search and assisted conversions.